
CTBF ML 2018/2019 SEASON
VOB
- Game Results
- Overall Stats
- Category Leaders
- Games Summary
- Analysis Stats
- Per-game Stats
- Game Highs
- Team Game-by-Game
| Game Results |
CTBF ML 2018/2019 SEASON
Game Results for VOB (as of Dec 19, 2018)
(All games)
| Game date | Opposing team | Score | Overall | Conference | Pitcher of record | Attend | Time | ||||
| * | Oct 20, 2018 | at | BELLVILLE TYGERS | W | 10-5 | 1-0-0 | 1-0-0 | PERKINS D (W 1-0) | 200 | 3H00 | |
| * | Oct 27, 2018 | BOTHASIG | 0-17 | L | 1-1-0 | 1-1-0 | PERKINS D (L 0-1) | 200 | 2H45 | ||
| * | Nov 03, 2018 | at | VD STEL | W | 10-6 | 2-1-0 | 2-1-0 | BAYLISS D (W 1-0) | 200 | 2H50 | |
| * | Nov 17, 2018 | CRUSADERS | W | 18-17 | 3-1-0 | 3-1-0 | SCRITTEN M (W 1-0) | 200 | 3H50 | ||
| * | Nov 18, 2018 | at | HELDERBERG PIRATES | 11-12 | L | 3-2-0 | 3-2-0 | LARNEY Z (L 0-1) | 200 | 3H20 | |
| * | Nov 24, 2018 | MAITLAND GIANTS | W | 19-4 | 4-2-0 | 4-2-0 | JOHNSON J (W 1-0) | 200 | 2H55 | ||
| * | Dec 02, 2018 | THISTLES | W | 6-5 | 5-2-0 | 5-2-0 | BAYLISS D (W 1-0) | 200 | 4H20 | ||
| * | Dec 01, 2018 | at | MAVERICKS | W | 21-4 | 6-2-0 | 6-2-0 | PERKINS D (W 1-0) | 200 | 2H40 | |
| * | Dec 08, 2018 | at | DURBANVILLE | 6-14 | L | 6-3-0 | 6-3-0 | BAYLISS D (L 0-1) | 200 | 3H20 | |
| * | Dec 16, 2018 | WESTRIDGE YANKEES | W | 10-6 | 7-3-0 | 7-3-0 | SCRITTEN M (W 1-0) | 200 | 3H15 |
| () extra inning game |
| Overall Statistics |
CTBF ML 2018/2019 SEASON
Overall Statistics for VOB (as of Dec 19, 2018)
(All games Sorted by Batting avg)
• Record: 7-3 • Home: 4-1 • Away: 3-2 • Conference: 7-3 •
| Player | avg | gp-gs | ab | r | h | 2b | 3b | hr | rbi | bb | hbp | so | sb-att |
| PRETORIUS Y | 1.000 | 2-0 | 1 | 2 | 1 | 0 | 0 | 0 | 1 | 0 | 0 | 0 | 0-0 |
| MULLINS K | 1.000 | 1-0 | 1 | 0 | 1 | 0 | 0 | 0 | 0 | 0 | 0 | 0 | 0-0 |
| THORNE J | .667 | 1-1 | 3 | 2 | 2 | 0 | 0 | 0 | 2 | 0 | 2 | 0 | 1-1 |
| MAHONEY MARV | .417 | 5-2 | 12 | 3 | 5 | 2 | 0 | 0 | 6 | 1 | 0 | 0 | 0-0 |
| BAYLISS D | .394 | 10-10 | 33 | 11 | 13 | 1 | 0 | 2 | 11 | 7 | 3 | 7 | 2-4 |
| GORDON L | .342 | 10-10 | 38 | 14 | 13 | 3 | 0 | 3 | 19 | 6 | 1 | 7 | 3-4 |
| HAYNES J | .333 | 7-7 | 24 | 12 | 8 | 3 | 0 | 0 | 1 | 8 | 3 | 9 | 6-7 |
| SCRITTEN M | .324 | 10-8 | 34 | 8 | 11 | 1 | 0 | 0 | 6 | 6 | 1 | 4 | 2-2 |
| PERKINS D | .313 | 7-5 | 16 | 4 | 5 | 1 | 0 | 0 | 2 | 1 | 0 | 7 | 1-2 |
| JOHNSON J | .286 | 10-10 | 28 | 12 | 8 | 1 | 0 | 3 | 9 | 8 | 0 | 6 | 1-2 |
| NOVEMBER L | .281 | 10-10 | 32 | 15 | 9 | 3 | 0 | 0 | 6 | 12 | 4 | 4 | 5-6 |
| LARNEY Z | .250 | 10-10 | 36 | 11 | 9 | 0 | 0 | 0 | 11 | 11 | 0 | 10 | 6-7 |
| WILLEMBERG L | .241 | 9-7 | 29 | 6 | 7 | 0 | 0 | 0 | 5 | 1 | 1 | 6 | 1-1 |
| BURCH J | .237 | 10-10 | 38 | 9 | 9 | 2 | 0 | 1 | 10 | 5 | 4 | 16 | 3-3 |
| BUDLER L | .167 | 3-1 | 6 | 1 | 1 | 0 | 0 | 0 | 0 | 0 | 0 | 1 | 0-0 |
| RANCK J | .000 | 1-0 | 1 | 0 | 0 | 0 | 0 | 0 | 0 | 0 | 0 | 1 | 0-0 |
| DARIUS M | .000 | 2-0 | 1 | 1 | 0 | 0 | 0 | 0 | 0 | 1 | 0 | 0 | 0-0 |
| JONES R | .000 | 2-0 | 1 | 0 | 0 | 0 | 0 | 0 | 0 | 0 | 1 | 0 | 0-0 |
| Totals | .305 | 10-10 | 334 | 111 | 102 | 17 | 0 | 9 | 89 | 67 | 20 | 78 | 31-39 |
| Opponents | .263 | 10-10 | 334 | 90 | 88 | 14 | 2 | 2 | 63 | 63 | 18 | 77 | 28-36 |
|
LOB – Team (88), Opp (94). DPs turned – Team (3), Opp (6). CI – Team (0), Opp (1). IBB – Team (0), Opp (1). Picked off – WILLEMBERG L 2, LARNEY Z 1, MAHONEY MARV 1, BAYLISS D 1, HAYNES J 1. |
(All games Sorted by Earned run avg)
| Player | era | w-l | app-gs | cg | sho | sv | ip | h | r | er | bb | so |
| SCRITTEN M | 4.38 | 2-0 | 3-1 | 0 | 0/0 | 1 | 12.1 | 8 | 10 | 6 | 9 | 9 |
| JOHNSON J | 5.52 | 1-0 | 6-3 | 0 | 0/0 | 0 | 14.2 | 12 | 18 | 9 | 19 | 18 |
| BAYLISS D | 5.97 | 2-1 | 7-4 | 0 | 0/0 | 1 | 31.2 | 46 | 35 | 21 | 11 | 19 |
| PERKINS D | 9.00 | 2-1 | 6-2 | 0 | 0/0 | 1 | 17.0 | 16 | 21 | 17 | 20 | 22 |
| LARNEY Z | 9.00 | 0-1 | 2-0 | 0 | 0/0 | 0 | 1.0 | 2 | 1 | 1 | 1 | 2 |
| THORNE J | 13.50 | 0-0 | 1-0 | 0 | 0/0 | 0 | 3.1 | 4 | 5 | 5 | 3 | 7 |
| Totals | 6.64 | 7-3 | 10-10 | 0 | 0/0 | 3 | 80.0 | 88 | 90 | 59 | 63 | 77 |
| Opponents | 8.58 | 3-7 | 10-10 | 0 | 1/1 | 2 | 78.2 | 102 | 111 | 75 | 67 | 78 |
|
PB – Team (6), GORDON L 5, NOVEMBER L 1, Opp (8). Pickoffs – Team (2), SCRITTEN M 1, PERKINS D 1, Opp (6). SBA/ATT – GORDON L (15-18), NOVEMBER L (13-18), BAYLISS D (10-15), JOHNSON J (10-11), PERKINS D (6-7), SCRITTEN M (1-2), THORNE J (1-1). |
(All games Sorted by Fielding pct)
| Player | c | po | a | e | fld% | dp | sba | csb | sba% | pb | ci |
| GORDON L | 49 | 44 | 5 | 0 | 1.000 | 0 | 15 | 3 | .833 | 5 | 0 |
| LARNEY Z | 16 | 15 | 1 | 0 | 1.000 | 0 | 0 | 0 | — | 0 | 0 |
| PERKINS D | 10 | 6 | 4 | 0 | 1.000 | 0 | 6 | 1 | .857 | 0 | 0 |
| BUDLER L | 4 | 3 | 1 | 0 | 1.000 | 0 | 0 | 0 | — | 0 | 0 |
| THORNE J | 2 | 0 | 2 | 0 | 1.000 | 0 | 1 | 0 | 1.000 | 0 | 0 |
| PRETORIUS Y | 1 | 1 | 0 | 0 | 1.000 | 0 | 0 | 0 | — | 0 | 0 |
| RANCK J | 1 | 0 | 1 | 0 | 1.000 | 0 | 0 | 0 | — | 0 | 0 |
| BURCH J | 83 | 76 | 5 | 2 | .976 | 2 | 0 | 0 | — | 0 | 0 |
| NOVEMBER L | 65 | 42 | 19 | 4 | .938 | 0 | 13 | 5 | .722 | 1 | 0 |
| HAYNES J | 12 | 11 | 0 | 1 | .917 | 0 | 0 | 0 | — | 0 | 0 |
| JOHNSON J | 40 | 19 | 17 | 4 | .900 | 1 | 10 | 1 | .909 | 0 | 0 |
| WILLEMBERG L | 33 | 8 | 18 | 7 | .788 | 2 | 0 | 0 | — | 0 | 0 |
| SCRITTEN M | 17 | 4 | 9 | 4 | .765 | 0 | 1 | 1 | .500 | 0 | 0 |
| BAYLISS D | 24 | 9 | 8 | 7 | .708 | 2 | 10 | 5 | .667 | 0 | 0 |
| MAHONEY MARV | 8 | 2 | 1 | 5 | .375 | 0 | 0 | 0 | — | 0 | 0 |
| MULLINS K | 3 | 0 | 1 | 2 | .333 | 0 | 0 | 0 | — | 0 | 0 |
| DARIUS M | 1 | 0 | 0 | 1 | .000 | 0 | 0 | 0 | — | 0 | 0 |
| JONES R | 0 | 0 | 0 | 0 | .000 | 0 | 0 | 0 | — | 0 | 0 |
| Totals | 369 | 240 | 92 | 37 | .900 | 3 | 28 | 8 | .778 | 6 | 0 |
| Opponents | 351 | 236 | 66 | 49 | .860 | 6 | 31 | 8 | .795 | 8 | 1 |
| Category Leaders |
CTBF ML 2018/2019 SEASON
Batting Leaders for VOB (as of Dec 19, 2018)
(All games)
| Batting avg 1. BAYLISS D .394 2. GORDON L .342 3. HAYNES J .333 4. SCRITTEN M .324 5. JOHNSON J .286 6. NOVEMBER L .281 7. LARNEY Z .250 8. WILLEMBERG L .241 9. BURCH J .237 | Slugging pct 1. GORDON L .658 2. JOHNSON J .643 3. BAYLISS D .606 4. HAYNES J .458 5. NOVEMBER L .375 6. BURCH J .368 7. SCRITTEN M .353 8. LARNEY Z .250 9. WILLEMBERG L .241 | On base pct 1. HAYNES J .543 2. BAYLISS D .511 3. NOVEMBER L .500 4. JOHNSON J .444 5. SCRITTEN M .439 6. GORDON L .426 7. LARNEY Z .408 8. BURCH J .367 9. WILLEMBERG L .290 |
| Runs scored 1. NOVEMBER L 15 2. GORDON L 14 3. HAYNES J 12 JOHNSON J 12 5. BAYLISS D 11 LARNEY Z 11 7. BURCH J 9 8. SCRITTEN M 8 9. WILLEMBERG L 6 10. PERKINS D 4 | Hits 1. GORDON L 13 BAYLISS D 13 3. SCRITTEN M 11 4. BURCH J 9 LARNEY Z 9 NOVEMBER L 9 7. JOHNSON J 8 HAYNES J 8 9. WILLEMBERG L 7 10. 2 tied at … 5 | Runs batted in 1. GORDON L 19 2. LARNEY Z 11 BAYLISS D 11 4. BURCH J 10 5. JOHNSON J 9 6. NOVEMBER L 6 SCRITTEN M 6 MAHONEY MARV 6 9. WILLEMBERG L 5 10. 2 tied at … 2 |
| Doubles 1. NOVEMBER L 3 GORDON L 3 HAYNES J 3 4. BURCH J 2 MAHONEY MARV 2 6. JOHNSON J 1 PERKINS D 1 SCRITTEN M 1 BAYLISS D 1 | Triples None | Home runs 1. JOHNSON J 3 GORDON L 3 3. BAYLISS D 2 4. BURCH J 1 |
| Total bases 1. GORDON L 25 2. BAYLISS D 20 3. JOHNSON J 18 4. BURCH J 14 5. SCRITTEN M 12 NOVEMBER L 12 7. HAYNES J 11 8. LARNEY Z 9 9. MAHONEY MARV 7 WILLEMBERG L 7 | Walks 1. NOVEMBER L 12 2. LARNEY Z 11 3. JOHNSON J 8 HAYNES J 8 5. BAYLISS D 7 6. GORDON L 6 SCRITTEN M 6 8. BURCH J 5 9. 4 tied at … 1 | Hit by pitch 1. BURCH J 4 NOVEMBER L 4 3. BAYLISS D 3 HAYNES J 3 5. THORNE J 2 6. SCRITTEN M 1 GORDON L 1 WILLEMBERG L 1 JONES R 1 |
| Sac bunts 1. BAYLISS D 1 JOHNSON J 1 WILLEMBERG L 1 | Sac flies 1. BAYLISS D 2 NOVEMBER L 2 LARNEY Z 2 BURCH J 2 GORDON L 2 | Stolen bases 1. LARNEY Z 6 HAYNES J 6 3. NOVEMBER L 5 4. BURCH J 3 GORDON L 3 6. SCRITTEN M 2 BAYLISS D 2 8. 4 tied at … 1 |
| Caught stealing 1. BAYLISS D 2 2. HAYNES J 1 NOVEMBER L 1 JOHNSON J 1 GORDON L 1 PERKINS D 1 LARNEY Z 1 | Steal attempts 1. LARNEY Z 7 HAYNES J 7 3. NOVEMBER L 6 4. GORDON L 4 BAYLISS D 4 6. BURCH J 3 7. PERKINS D 2 JOHNSON J 2 SCRITTEN M 2 10. 2 tied at … 1 | Stolen base pct 1. BURCH J 1.000 SCRITTEN M 1.000 WILLEMBERG L 1.000 4. LARNEY Z .857 HAYNES J .857 6. NOVEMBER L .833 7. GORDON L .750 8. BAYLISS D .500 JOHNSON J .500 |
| Strikeouts 1. BURCH J 16 2. LARNEY Z 10 3. HAYNES J 9 4. BAYLISS D 7 PERKINS D 7 GORDON L 7 7. WILLEMBERG L 6 JOHNSON J 6 9. NOVEMBER L 4 SCRITTEN M 4 | Grounded into DP 1. BAYLISS D 2 2. GORDON L 1 | Total plate appearances 1. NOVEMBER L 50 2. BURCH J 49 LARNEY Z 49 4. GORDON L 47 5. BAYLISS D 46 6. SCRITTEN M 41 7. JOHNSON J 38 8. HAYNES J 35 9. WILLEMBERG L 32 10. PERKINS D 17 |
| At bats 1. BURCH J 38 GORDON L 38 3. LARNEY Z 36 4. SCRITTEN M 34 5. BAYLISS D 33 6. NOVEMBER L 32 7. WILLEMBERG L 29 8. JOHNSON J 28 9. HAYNES J 24 10. PERKINS D 16 | Games played 1. BURCH J 10 GORDON L 10 LARNEY Z 10 SCRITTEN M 10 BAYLISS D 10 NOVEMBER L 10 JOHNSON J 10 8. WILLEMBERG L 9 9. HAYNES J 7 PERKINS D 7 | Game starts 1. BURCH J 10 GORDON L 10 LARNEY Z 10 JOHNSON J 10 BAYLISS D 10 NOVEMBER L 10 7. SCRITTEN M 8 8. WILLEMBERG L 7 HAYNES J 7 10. PERKINS D 5 |
| Games as sub 1. MAHONEY MARV 3 2. DARIUS M 2 JONES R 2 BUDLER L 2 PERKINS D 2 SCRITTEN M 2 WILLEMBERG L 2 PRETORIUS Y 2 9. MULLINS K 1 RANCK J 1 |
CTBF ML 2018/2019 SEASON
Batting Analysis Leaders for VOB (as of Dec 19, 2018)
(All games)
| Avg vs left 1. LARNEY Z 1.000 2. NOVEMBER L .500 HAYNES J .500 4. SCRITTEN M .333 WILLEMBERG L .333 JOHNSON J .333 7. GORDON L .200 BURCH J .200 9. BAYLISS D .000 | Avg vs right 1. BAYLISS D .448 2. GORDON L .364 3. SCRITTEN M .323 4. HAYNES J .300 5. JOHNSON J .280 6. NOVEMBER L .250 7. BURCH J .242 8. WILLEMBERG L .231 9. LARNEY Z .229 | Pct reach as leadoff 1. BAYLISS D .500 NOVEMBER L .500 HAYNES J .500 4. BURCH J .429 5. GORDON L .400 6. LARNEY Z .375 7. SCRITTEN M .333 8. JOHNSON J .300 9. WILLEMBERG L .250 |
| Avg w/2 outs 1. GORDON L .625 2. BAYLISS D .455 3. JOHNSON J .375 4. LARNEY Z .308 5. NOVEMBER L .300 6. SCRITTEN M .250 HAYNES J .250 8. WILLEMBERG L .182 9. BURCH J .143 | Avg w/bases empty 1. MULLINS K 1.000 2. HAYNES J .357 3. PERKINS D .333 4. BAYLISS D .308 5. GORDON L .294 6. BURCH J .273 7. NOVEMBER L .231 8. SCRITTEN M .222 9. JOHNSON J .214 10. WILLEMBERG L .154 | Avg w/runners 1. BAYLISS D .450 2. SCRITTEN M .438 3. GORDON L .381 4. JOHNSON J .357 5. LARNEY Z .333 6. NOVEMBER L .316 7. WILLEMBERG L .313 8. HAYNES J .300 9. BURCH J .222 |
| Avg w/bases loaded 1. PERKINS D 1.000 MAHONEY MARV 1.000 3. SCRITTEN M .500 4. GORDON L .250 5. BURCH J .000 LARNEY Z .000 BAYLISS D .000 NOVEMBER L .000 WILLEMBERG L .000 HAYNES J .000 | Avg w/RBI ops 1. BAYLISS D .538 2. GORDON L .412 3. JOHNSON J .364 4. NOVEMBER L .357 5. LARNEY Z .316 6. SCRITTEN M .273 WILLEMBERG L .273 8. BURCH J .200 9. HAYNES J .143 | Pct adv runners 1. LARNEY Z .643 2. BAYLISS D .615 3. WILLEMBERG L .611 JOHNSON J .611 5. GORDON L .560 NOVEMBER L .560 7. SCRITTEN M .556 8. BURCH J .469 9. HAYNES J .364 |
| Pinch hitting avg 1. WILLEMBERG L 1.000 PERKINS D 1.000 PRETORIUS Y 1.000 MAHONEY MARV 1.000 5. RANCK J .000 DARIUS M .000 JONES R .000 | Pinch hit at bats 1. WILLEMBERG L 2 2. PRETORIUS Y 1 PERKINS D 1 JONES R 1 DARIUS M 1 RANCK J 1 MAHONEY MARV 1 | Pinch hits 1. WILLEMBERG L 2 2. PRETORIUS Y 1 MAHONEY MARV 1 PERKINS D 1 |
| 2-out RBIs 1. GORDON L 10 2. BURCH J 5 3. JOHNSON J 4 4. BAYLISS D 3 LARNEY Z 3 6. NOVEMBER L 1 THORNE J 1 PERKINS D 1 SCRITTEN M 1 WILLEMBERG L 1 | Runners advanced 1. NOVEMBER L 7 2. BAYLISS D 5 WILLEMBERG L 5 4. GORDON L 3 5. BURCH J 2 JOHNSON J 2 LARNEY Z 2 8. SCRITTEN M 1 | Runners left on base 1. BURCH J 16 2. SCRITTEN M 11 3. WILLEMBERG L 10 LARNEY Z 10 GORDON L 10 6. BAYLISS D 6 NOVEMBER L 6 8. PERKINS D 5 9. HAYNES J 4 10. JOHNSON J 3 |
| Fly outs 1. SCRITTEN M 14 2. GORDON L 13 3. NOVEMBER L 12 4. BAYLISS D 10 5. LARNEY Z 9 6. JOHNSON J 8 BURCH J 8 8. MAHONEY MARV 7 9. WILLEMBERG L 5 10. 2 tied at … 3 | Ground outs 1. WILLEMBERG L 8 2. JOHNSON J 5 NOVEMBER L 5 LARNEY Z 5 SCRITTEN M 5 6. BAYLISS D 4 7. BUDLER L 3 BURCH J 3 GORDON L 3 HAYNES J 3 | Fly outs/Ground outs 1. GORDON L 4.33 2. SCRITTEN M 2.80 3. BURCH J 2.67 4. BAYLISS D 2.50 5. NOVEMBER L 2.40 6. LARNEY Z 1.80 7. JOHNSON J 1.60 8. HAYNES J 1.00 9. WILLEMBERG L 0.63 |
| Ground outs/Fly outs 1. WILLEMBERG L 1.60 2. HAYNES J 1.00 3. JOHNSON J 0.63 4. LARNEY Z 0.56 5. NOVEMBER L 0.42 6. BAYLISS D 0.40 7. BURCH J 0.38 8. SCRITTEN M 0.36 9. GORDON L 0.23 |
CTBF ML 2018/2019 SEASON
Batting Per-Game Leaders for VOB (as of Dec 19, 2018)
(All games)
| Hits per game 1. GORDON L 1.30 BAYLISS D 1.30 3. HAYNES J 1.14 4. SCRITTEN M 1.10 5. BURCH J 0.90 LARNEY Z 0.90 NOVEMBER L 0.90 8. JOHNSON J 0.80 9. WILLEMBERG L 0.78 | Runs scored per game 1. HAYNES J 1.71 2. NOVEMBER L 1.50 3. GORDON L 1.40 4. JOHNSON J 1.20 5. LARNEY Z 1.10 BAYLISS D 1.10 7. BURCH J 0.90 8. SCRITTEN M 0.80 9. WILLEMBERG L 0.67 | Doubles per game 1. HAYNES J 0.43 2. GORDON L 0.30 NOVEMBER L 0.30 4. BURCH J 0.20 5. SCRITTEN M 0.10 BAYLISS D 0.10 JOHNSON J 0.10 8. LARNEY Z 0.00 WILLEMBERG L 0.00 |
| Triples per game 1. BURCH J 0.00 GORDON L 0.00 LARNEY Z 0.00 SCRITTEN M 0.00 BAYLISS D 0.00 NOVEMBER L 0.00 WILLEMBERG L 0.00 JOHNSON J 0.00 HAYNES J 0.00 | Homers per game 1. GORDON L 0.30 JOHNSON J 0.30 3. BAYLISS D 0.20 4. BURCH J 0.10 5. LARNEY Z 0.00 SCRITTEN M 0.00 NOVEMBER L 0.00 WILLEMBERG L 0.00 HAYNES J 0.00 | RBIs per game 1. GORDON L 1.90 2. LARNEY Z 1.10 BAYLISS D 1.10 4. BURCH J 1.00 5. JOHNSON J 0.90 6. SCRITTEN M 0.60 NOVEMBER L 0.60 8. WILLEMBERG L 0.56 9. HAYNES J 0.14 |
| Stolen bases per game 1. HAYNES J 0.86 2. LARNEY Z 0.60 3. NOVEMBER L 0.50 4. BURCH J 0.30 GORDON L 0.30 6. SCRITTEN M 0.20 BAYLISS D 0.20 8. WILLEMBERG L 0.11 9. JOHNSON J 0.10 | Walks per game 1. NOVEMBER L 1.20 2. HAYNES J 1.14 3. LARNEY Z 1.10 4. JOHNSON J 0.80 5. BAYLISS D 0.70 6. GORDON L 0.60 SCRITTEN M 0.60 8. BURCH J 0.50 9. WILLEMBERG L 0.11 | Strikeouts per game 1. SCRITTEN M 0.40 NOVEMBER L 0.40 3. JOHNSON J 0.60 4. WILLEMBERG L 0.67 5. GORDON L 0.70 BAYLISS D 0.70 7. LARNEY Z 1.00 8. HAYNES J 1.29 9. BURCH J 1.60 |
| At bats per game 1. GORDON L 3.80 BURCH J 3.80 3. LARNEY Z 3.60 4. HAYNES J 3.43 5. SCRITTEN M 3.40 6. BAYLISS D 3.30 7. WILLEMBERG L 3.22 8. NOVEMBER L 3.20 9. JOHNSON J 2.80 | Plate appearances/game 1. NOVEMBER L 5.00 HAYNES J 5.00 3. BURCH J 4.90 LARNEY Z 4.90 5. GORDON L 4.70 6. BAYLISS D 4.60 7. SCRITTEN M 4.10 8. JOHNSON J 3.80 9. WILLEMBERG L 3.56 |
CTBF ML 2018/2019 SEASON
Pitching Leaders for VOB (as of Dec 19, 2018)
(All games)
| Earned run avg 1. SCRITTEN M 4.38 2. JOHNSON J 5.52 3. BAYLISS D 5.97 4. PERKINS D 9.00 LARNEY Z 9.00 6. THORNE J 13.50 | Opposing bat avg 1. SCRITTEN M .174 2. JOHNSON J .200 3. PERKINS D .242 4. THORNE J .286 5. BAYLISS D .322 6. LARNEY Z .400 | Won-loss pct 1. SCRITTEN M 1.000 JOHNSON J 1.000 3. PERKINS D .667 BAYLISS D .667 5. LARNEY Z .000 6. THORNE J .000 |
| Wins 1. SCRITTEN M 2 BAYLISS D 2 PERKINS D 2 4. JOHNSON J 1 | Losses 1. BAYLISS D 1 PERKINS D 1 LARNEY Z 1 | Saves 1. BAYLISS D 1 PERKINS D 1 SCRITTEN M 1 |
| Innings pitched 1. BAYLISS D 31.2 2. PERKINS D 17.0 3. JOHNSON J 14.2 4. SCRITTEN M 12.1 5. THORNE J 3.1 6. LARNEY Z 1.0 | Batters struck out 1. PERKINS D 22 2. BAYLISS D 19 3. JOHNSON J 18 4. SCRITTEN M 9 5. THORNE J 7 6. LARNEY Z 2 | Appearances 1. BAYLISS D 7 2. JOHNSON J 6 PERKINS D 6 4. SCRITTEN M 3 5. LARNEY Z 2 6. THORNE J 1 |
| Games started 1. BAYLISS D 4 2. JOHNSON J 3 3. PERKINS D 2 4. SCRITTEN M 1 | Games finished 1. PERKINS D 2 LARNEY Z 2 JOHNSON J 2 SCRITTEN M 2 BAYLISS D 2 | Games in relief 1. PERKINS D 4 2. BAYLISS D 3 JOHNSON J 3 4. SCRITTEN M 2 LARNEY Z 2 6. THORNE J 1 |
| Wild pitches 1. PERKINS D 5 2. JOHNSON J 4 3. LARNEY Z 1 | Balks 1. JOHNSON J 1 | Hit batters 1. SCRITTEN M 5 BAYLISS D 5 3. THORNE J 4 4. JOHNSON J 3 5. PERKINS D 1 |
| Intentional BB allowed 1. BAYLISS D 1 | Runners picked off 1. SCRITTEN M 1 PERKINS D 1 | Batters SO out looking 1. BAYLISS D 6 PERKINS D 6 3. SCRITTEN M 4 4. JOHNSON J 2 5. THORNE J 1 |
| Sac bunts allowed 1. SCRITTEN M 2 2. PERKINS D 1 JOHNSON J 1 | Sac flies allowed 1. BAYLISS D 3 2. PERKINS D 1 SCRITTEN M 1 | Hits allowed 1. LARNEY Z 2 2. THORNE J 4 3. SCRITTEN M 8 4. JOHNSON J 12 5. PERKINS D 16 6. BAYLISS D 46 |
| Runs allowed 1. LARNEY Z 1 2. THORNE J 5 3. SCRITTEN M 10 4. JOHNSON J 18 5. PERKINS D 21 6. BAYLISS D 35 | Earned runs allowed 1. LARNEY Z 1 2. THORNE J 5 3. SCRITTEN M 6 4. JOHNSON J 9 5. PERKINS D 17 6. BAYLISS D 21 | Walks allowed 1. LARNEY Z 1 2. THORNE J 3 3. SCRITTEN M 9 4. BAYLISS D 11 5. JOHNSON J 19 6. PERKINS D 20 |
| Doubles allowed 1. LARNEY Z 0 SCRITTEN M 0 3. THORNE J 1 4. JOHNSON J 2 5. PERKINS D 4 6. BAYLISS D 7 | Triples allowed 1. LARNEY Z 0 SCRITTEN M 0 THORNE J 0 JOHNSON J 0 PERKINS D 0 6. BAYLISS D 2 | Home runs allowed 1. LARNEY Z 0 PERKINS D 0 THORNE J 0 JOHNSON J 0 5. SCRITTEN M 1 BAYLISS D 1 |
CTBF ML 2018/2019 SEASON
Pitching Analysis Leaders for VOB (as of Dec 19, 2018)
(All games)
| B/avg vs left 1. THORNE J .000 LARNEY Z .000 3. JOHNSON J .000 SCRITTEN M .000 5. PERKINS D .200 6. BAYLISS D 1.000 | B/avg vs right 1. JOHNSON J .203 2. SCRITTEN M .216 3. PERKINS D .246 4. THORNE J .286 5. BAYLISS D .297 6. LARNEY Z .400 | B/avg vs leadoff 1. LARNEY Z .000 2. JOHNSON J .412 3. PERKINS D .467 4. SCRITTEN M .538 5. BAYLISS D .581 6. THORNE J .750 |
| B/avg w/2 outs 1. PERKINS D .091 2. JOHNSON J .111 3. SCRITTEN M .143 4. THORNE J .250 5. BAYLISS D .340 6. LARNEY Z .500 | B/avg w/runners 1. SCRITTEN M .138 2. THORNE J .200 3. JOHNSON J .278 4. BAYLISS D .291 5. PERKINS D .300 6. LARNEY Z .400 | Fly ball outs 1. BAYLISS D 34 2. PERKINS D 16 3. SCRITTEN M 13 4. JOHNSON J 5 5. THORNE J 1 LARNEY Z 1 |
| Ground ball outs 1. BAYLISS D 35 2. JOHNSON J 19 3. SCRITTEN M 12 4. PERKINS D 11 5. THORNE J 2 | Fly/Ground outs 1. LARNEY Z 99.00 2. PERKINS D 1.45 3. SCRITTEN M 1.08 4. BAYLISS D 0.97 5. THORNE J 0.50 6. JOHNSON J 0.26 | Ground/Fly outs 1. JOHNSON J 3.80 2. THORNE J 2.00 3. BAYLISS D 1.03 4. SCRITTEN M 0.92 5. PERKINS D 0.69 6. LARNEY Z 0.00 |
CTBF ML 2018/2019 SEASON
Pitching Per-Game leaders for VOB (as of Dec 19, 2018)
(All games)
| Innings per game 1. BAYLISS D 4.52 2. SCRITTEN M 4.11 3. THORNE J 3.33 4. PERKINS D 2.83 5. JOHNSON J 2.44 6. LARNEY Z 0.50 | Strikeouts/game 1. THORNE J 18.90 2. LARNEY Z 18.00 3. PERKINS D 11.65 4. JOHNSON J 11.05 5. SCRITTEN M 6.57 6. BAYLISS D 5.40 | Walks allowed/game 1. BAYLISS D 3.13 2. SCRITTEN M 6.57 3. THORNE J 8.10 4. LARNEY Z 9.00 5. PERKINS D 10.59 6. JOHNSON J 11.66 |
| Doubles allowed/game 1. SCRITTEN M 0.00 LARNEY Z 0.00 3. JOHNSON J 1.23 4. BAYLISS D 1.99 5. PERKINS D 2.12 6. THORNE J 2.70 | Triples allowed/game 1. PERKINS D 0.00 JOHNSON J 0.00 SCRITTEN M 0.00 THORNE J 0.00 LARNEY Z 0.00 6. BAYLISS D 0.57 | Homers allowed/game 1. PERKINS D 0.00 JOHNSON J 0.00 THORNE J 0.00 LARNEY Z 0.00 5. BAYLISS D 0.28 6. SCRITTEN M 0.73 |
| Fly outs/game 1. BAYLISS D 9.66 2. SCRITTEN M 9.49 3. LARNEY Z 9.00 4. PERKINS D 8.47 5. JOHNSON J 3.07 6. THORNE J 2.70 | Ground outs/game 1. JOHNSON J 11.66 2. BAYLISS D 9.95 3. SCRITTEN M 8.76 4. PERKINS D 5.82 5. THORNE J 5.40 | Batters faced/game 1. THORNE J 56.70 2. LARNEY Z 54.00 3. JOHNSON J 50.93 4. PERKINS D 47.12 5. BAYLISS D 46.04 6. SCRITTEN M 45.97 |
| Hits allowed/game 1. SCRITTEN M 5.84 2. JOHNSON J 7.36 3. PERKINS D 8.47 4. THORNE J 10.80 5. BAYLISS D 13.07 6. LARNEY Z 18.00 | Runs allowed/game 1. SCRITTEN M 7.30 2. LARNEY Z 9.00 3. BAYLISS D 9.95 4. JOHNSON J 11.05 5. PERKINS D 11.12 6. THORNE J 13.50 | Earned runs/game 1. SCRITTEN M 4.38 2. JOHNSON J 5.52 3. BAYLISS D 5.97 4. PERKINS D 9.00 LARNEY Z 9.00 6. THORNE J 13.50 |
CTBF ML 2018/2019 SEASON
Fielding Leaders for VOB (as of Dec 19, 2018)
(All games)
| Fielding pct 1. GORDON L 1.000 LARNEY Z 1.000 PERKINS D 1.000 4. BURCH J .976 5. NOVEMBER L .938 6. HAYNES J .917 7. JOHNSON J .900 8. WILLEMBERG L .788 9. SCRITTEN M .765 10. BAYLISS D .708 | Chances 1. BURCH J 83 2. NOVEMBER L 65 3. GORDON L 49 4. JOHNSON J 40 5. WILLEMBERG L 33 6. BAYLISS D 24 7. SCRITTEN M 17 8. LARNEY Z 16 9. HAYNES J 12 10. PERKINS D 10 | Putouts 1. BURCH J 76 2. GORDON L 44 3. NOVEMBER L 42 4. JOHNSON J 19 5. LARNEY Z 15 6. HAYNES J 11 7. BAYLISS D 9 8. WILLEMBERG L 8 9. PERKINS D 6 10. SCRITTEN M 4 |
| Assists 1. NOVEMBER L 19 2. WILLEMBERG L 18 3. JOHNSON J 17 4. SCRITTEN M 9 5. BAYLISS D 8 6. GORDON L 5 BURCH J 5 8. PERKINS D 4 9. THORNE J 2 10. 5 tied at … 1 | Errors 1. BAYLISS D 7 WILLEMBERG L 7 3. MAHONEY MARV 5 4. SCRITTEN M 4 JOHNSON J 4 NOVEMBER L 4 7. BURCH J 2 MULLINS K 2 9. DARIUS M 1 HAYNES J 1 | Fielding double plays 1. BAYLISS D 2 WILLEMBERG L 2 BURCH J 2 4. JOHNSON J 1 |
| Stolen bases against 1. GORDON L 15 2. NOVEMBER L 13 3. JOHNSON J 10 BAYLISS D 10 5. PERKINS D 6 6. THORNE J 1 SCRITTEN M 1 | Caught stealing by 1. NOVEMBER L 5 BAYLISS D 5 3. GORDON L 3 4. PERKINS D 1 SCRITTEN M 1 JOHNSON J 1 | Steal attempts against 1. GORDON L 18 NOVEMBER L 18 3. BAYLISS D 15 4. JOHNSON J 11 5. PERKINS D 7 6. SCRITTEN M 2 7. THORNE J 1 |
| Passed balls 1. GORDON L 5 2. NOVEMBER L 1 | Catchers interference None |
| Games Summary |
CTBF ML 2018/2019 SEASON
Games Summary for VOB (as of Dec 19, 2018)
(All games)
| Inning-by-inning | 1 | 2 | 3 | 4 | 5 | 6 | 7 | 8 | 9 | EX | Total |
| VOB | 26 | 5 | 12 | 22 | 12 | 16 | 8 | 2 | 6 | 2 | 111 |
| Opponents | 15 | 14 | 12 | 8 | 13 | 6 | 17 | 4 | 0 | 1 | 90 |
| Win-Loss record when … | |
| Overall 7-3 Conference 7-3 Non-Conference 0-0 Home games 4-1 Away games 3-2 Neutral site 0-0 Day games 7-3 Night games 0-0 vs Left starter 1-0 vs Right starter 6-3 1-Run games 2-1 2-Run games 0-0 5+Run games 3-2 Extra innings 1-0 Shutouts 0-1 Scoring 0-2 runs 0-1 … 3-5 runs 0-0 … 6-9 runs 1-1 … 10+ runs 6-1 Opponent 0-2 runs 0-0 … 3-5 runs 4-0 … 6-9 runs 2-0 … 10+ runs 1-3 Scored in 1st inning 5-2 Opp. scored in 1st 4-3 Scores first 3-2 Opp. scores first 4-1 | After 6 leading 3-1 … trailing 1-2 … tied 1-0 After 7 leading 4-1 … trailing 1-1 … tied 0-0 After 8 leading 4-0 … trailing 1-2 … tied 0-0 Hit 0 home runs 5-3 … 1 home run 0-0 … 2+ home runs 2-0 Opponent 0 home runs 6-2 … 1 home run 1-1 … 2+ HRs 0-0 Made 0 errors 0-0 … 1 error 1-0 … 2+ errors 6-3 Opp. made 0 errors 0-0 … 1 error 0-1 … 2+ errors 7-2 Out-hit opponent 6-0 Out-hit by opponent 0-3 Hits are tied 1-0 |
Record when team scores:
| Runs | 0 | 1 | 2 | 3 | 4 | 5 | 6 | 7 | 8 | 9 | 10+ |
| W-L | 0-1 | 0-0 | 0-0 | 0-0 | 0-0 | 0-0 | 1-1 | 0-0 | 0-0 | 0-0 | 6-1 |
Record when opponent scores:
| Runs | 0 | 1 | 2 | 3 | 4 | 5 | 6 | 7 | 8 | 9 | 10+ |
| W-L | 0-0 | 0-0 | 0-0 | 0-0 | 2-0 | 2-0 | 2-0 | 0-0 | 0-0 | 0-0 | 1-3 |
Record when leading after:
| Innning | 1 | 2 | 3 | 4 | 5 | 6 | 7 | 8 |
| W-L | 4-1 | 3-1 | 4-0 | 4-1 | 3-1 | 3-1 | 4-1 | 4-0 |
Record when trailing after:
| Innning | 1 | 2 | 3 | 4 | 5 | 6 | 7 | 8 |
| W-L | 1-1 | 3-1 | 3-3 | 3-2 | 3-2 | 1-2 | 1-1 | 1-2 |
Record when tied after:
| Innning | 1 | 2 | 3 | 4 | 5 | 6 | 7 | 8 |
| W-L | 2-1 | 1-1 | 0-0 | 0-0 | 0-0 | 1-0 | 0-0 | 0-0 |
Won-loss streaks:
| Current winning streak | 1 |
| Longest winning streak | 3 |
| Longest losing streak | 1 |
| Attendance | Total | Dates | Average |
| HOME | 1000 | 5 | 200 |
| AWAY | 1000 | 5 | 200 |
| TOTAL | 2000 | 10 | 200 |
| Analysis Statistics |
CTBF ML 2018/2019 SEASON
Batting Analysis for VOB (as of Dec 19, 2018)
(All games Sorted by Player Name)
| vs Left | vs Right | w/runners on | w/bases empty | w/bases loaded | rch by leadoff | fly | gnd | fly/ | |||||||||||||
| Player | h | ab | avg | h | ab | avg | h | ab | avg | h | ab | avg | rch | ops | pct | h | ab | avg | out | out | gnd |
| BAYLISS D | 0 | 4 | .000 | 13 | 29 | .448 | 9 | 20 | .450 | 4 | 13 | .308 | 0 | 1 | .000 | 3 | 6 | .500 | 10 | 4 | 2.5 |
| PERKINS D | 0 | 0 | — | 5 | 16 | .313 | 2 | 7 | .286 | 3 | 9 | .333 | 1 | 1 | 1.000 | 1 | 4 | .250 | 3 | 1 | 3.0 |
| BURCH J | 1 | 5 | .200 | 8 | 33 | .242 | 6 | 27 | .222 | 3 | 11 | .273 | 0 | 2 | .000 | 3 | 7 | .429 | 8 | 3 | 2.7 |
| HAYNES J | 2 | 4 | .500 | 6 | 20 | .300 | 3 | 10 | .300 | 5 | 14 | .357 | 0 | 3 | .000 | 6 | 12 | .500 | 3 | 3 | 1.0 |
| JOHNSON J | 1 | 3 | .333 | 7 | 25 | .280 | 5 | 14 | .357 | 3 | 14 | .214 | 0 | 0 | — | 3 | 10 | .300 | 8 | 5 | 1.6 |
| RANCK J | 0 | 0 | — | 0 | 1 | .000 | 0 | 0 | — | 0 | 1 | .000 | 0 | 0 | — | 0 | 0 | — | 0 | 0 | 0.0 |
| THORNE J | 0 | 0 | — | 2 | 3 | .667 | 2 | 3 | .667 | 0 | 0 | — | 0 | 0 | — | 0 | 0 | — | 0 | 0 | 0.0 |
| MULLINS K | 0 | 0 | — | 1 | 1 | 1.000 | 0 | 0 | — | 1 | 1 | 1.000 | 0 | 0 | — | 1 | 1 | 1.000 | 0 | 0 | 0.0 |
| BUDLER L | 0 | 0 | — | 1 | 6 | .167 | 1 | 4 | .250 | 0 | 2 | .000 | 0 | 0 | — | 0 | 0 | — | 1 | 3 | 0.3 |
| GORDON L | 1 | 5 | .200 | 12 | 33 | .364 | 8 | 21 | .381 | 5 | 17 | .294 | 1 | 4 | .250 | 4 | 10 | .400 | 13 | 3 | 4.3 |
| NOVEMBER L | 2 | 4 | .500 | 7 | 28 | .250 | 6 | 19 | .316 | 3 | 13 | .231 | 0 | 1 | .000 | 3 | 6 | .500 | 12 | 5 | 2.4 |
| WILLEMBERG L | 1 | 3 | .333 | 6 | 26 | .231 | 5 | 16 | .313 | 2 | 13 | .154 | 0 | 2 | .000 | 1 | 4 | .250 | 5 | 8 | 0.6 |
| DARIUS M | 0 | 0 | — | 0 | 1 | .000 | 0 | 1 | .000 | 0 | 0 | — | 0 | 0 | — | 0 | 0 | — | 1 | 0 | 99.9 |
| SCRITTEN M | 1 | 3 | .333 | 10 | 31 | .323 | 7 | 16 | .438 | 4 | 18 | .222 | 1 | 2 | .500 | 3 | 9 | .333 | 14 | 5 | 2.8 |
| MAHONEY MARV | 2 | 3 | .667 | 3 | 9 | .333 | 4 | 5 | .800 | 1 | 7 | .143 | 1 | 1 | 1.000 | 1 | 3 | .333 | 7 | 1 | 7.0 |
| JONES R | 0 | 0 | — | 0 | 1 | .000 | 0 | 1 | .000 | 0 | 0 | — | 0 | 0 | — | 0 | 0 | — | 1 | 0 | 99.9 |
| PRETORIUS Y | 0 | 0 | — | 1 | 1 | 1.000 | 1 | 1 | 1.000 | 0 | 0 | — | 0 | 0 | — | 0 | 0 | — | 0 | 0 | 0.0 |
| LARNEY Z | 1 | 1 | 1.000 | 8 | 35 | .229 | 7 | 21 | .333 | 2 | 15 | .133 | 0 | 2 | .000 | 3 | 8 | .375 | 9 | 5 | 1.8 |
| Totals | 12 | 35 | .343 | 90 | 299 | .301 | 66 | 186 | .355 | 36 | 148 | .243 | 4 | 19 | .211 | 32 | 80 | .400 | 95 | 46 | 2.1 |
| Opponents | 0 | 0 | — | 88 | 334 | .263 | 55 | 206 | .267 | 33 | 128 | .258 | 6 | 31 | .194 | 42 | 80 | .525 | 70 | 79 | 0.9 |
| pinch hitting | with runners in scoring pos | w/rnr on 3rd and LT 2 out | with 2 outs | 2- out | success advancing rnrs | #rnrs adv | rnrs | rch | rch | ||||||||||||
| Player | h | ab | avg | h | ab | avg | rbi | ops | pct | h | ab | avg | rbi | adv | ops | pct | w/out | lob | err | fc | kl |
| BAYLISS D | 0 | 0 | — | 7 | 13 | .538 | 5 | 8 | .625 | 5 | 11 | .455 | 3 | 16 | 26 | .615 | 5 | 6 | 2 | 0 | 2 |
| PERKINS D | 1 | 1 | 1.000 | 2 | 6 | .333 | 1 | 2 | .500 | 2 | 6 | .333 | 1 | 2 | 7 | .286 | 0 | 5 | 0 | 0 | 1 |
| BURCH J | 0 | 0 | — | 4 | 20 | .200 | 4 | 9 | .444 | 2 | 14 | .143 | 5 | 15 | 32 | .469 | 2 | 16 | 4 | 0 | 3 |
| HAYNES J | 0 | 0 | — | 1 | 7 | .143 | 1 | 3 | .333 | 1 | 4 | .250 | 0 | 4 | 11 | .364 | 0 | 4 | 1 | 1 | 3 |
| JOHNSON J | 0 | 0 | — | 4 | 11 | .364 | 2 | 3 | .667 | 3 | 8 | .375 | 4 | 11 | 18 | .611 | 2 | 3 | 2 | 1 | 2 |
| RANCK J | 0 | 1 | .000 | 0 | 0 | — | 0 | 0 | — | 0 | 0 | — | 0 | 0 | 0 | — | 0 | 0 | 0 | 0 | 1 |
| THORNE J | 0 | 0 | — | 2 | 3 | .667 | 1 | 1 | 1.000 | 1 | 1 | 1.000 | 1 | 3 | 3 | 1.000 | 0 | 0 | 1 | 0 | 0 |
| MULLINS K | 0 | 0 | — | 0 | 0 | — | 0 | 0 | — | 0 | 0 | — | 0 | 0 | 0 | — | 0 | 0 | 0 | 0 | 0 |
| BUDLER L | 0 | 0 | — | 0 | 2 | .000 | 0 | 0 | — | 1 | 4 | .250 | 0 | 1 | 4 | .250 | 0 | 1 | 0 | 0 | 1 |
| GORDON L | 0 | 0 | — | 7 | 17 | .412 | 5 | 8 | .625 | 10 | 16 | .625 | 10 | 14 | 25 | .560 | 3 | 10 | 4 | 1 | 1 |
| NOVEMBER L | 0 | 0 | — | 5 | 14 | .357 | 4 | 8 | .500 | 3 | 10 | .300 | 1 | 14 | 25 | .560 | 7 | 6 | 4 | 0 | 4 |
| WILLEMBERG L | 2 | 2 | 1.000 | 3 | 11 | .273 | 4 | 5 | .800 | 2 | 11 | .182 | 1 | 11 | 18 | .611 | 5 | 10 | 3 | 2 | 3 |
| DARIUS M | 0 | 1 | .000 | 0 | 1 | .000 | 0 | 0 | — | 0 | 0 | — | 0 | 0 | 1 | .000 | 0 | 1 | 0 | 0 | 0 |
| SCRITTEN M | 0 | 0 | — | 3 | 11 | .273 | 3 | 3 | 1.000 | 3 | 12 | .250 | 1 | 10 | 18 | .556 | 1 | 11 | 0 | 1 | 3 |
| MAHONEY MARV | 1 | 1 | 1.000 | 4 | 5 | .800 | 3 | 3 | 1.000 | 0 | 2 | .000 | 0 | 4 | 5 | .800 | 0 | 0 | 0 | 0 | 0 |
| JONES R | 0 | 1 | .000 | 0 | 1 | .000 | 0 | 0 | — | 0 | 0 | — | 0 | 1 | 2 | .500 | 0 | 0 | 0 | 0 | 0 |
| PRETORIUS Y | 1 | 1 | 1.000 | 1 | 1 | 1.000 | 0 | 0 | — | 0 | 0 | — | 0 | 1 | 1 | 1.000 | 0 | 0 | 0 | 0 | 0 |
| LARNEY Z | 0 | 0 | — | 6 | 19 | .316 | 7 | 10 | .700 | 4 | 13 | .308 | 3 | 18 | 28 | .643 | 2 | 10 | 4 | 1 | 2 |
| Totals | 5 | 8 | .625 | 49 | 142 | .345 | 40 | 63 | .635 | 37 | 112 | .330 | 30 | 125 | 224 | .558 | 27 | 88 | 25 | 7 | 26 |
| Opponents | 0 | 1 | .000 | 39 | 154 | .253 | 29 | 57 | .509 | 26 | 112 | .232 | 24 | 133 | 244 | .545 | 40 | 94 | 27 | 10 | 19 |
|
Success Advancing Runners = percentage of times the batter advanced at least one runner during a plate appearance #Rnrs Adv w/Out = TOTAL number of runners advanced when the player made an out |
CTBF ML 2018/2019 SEASON
Pitching Analysis for VOB (as of Dec 19, 2018)
(All games Sorted by Player Name)
| vs Left | vs Right | w/runners on | w/bases empty | rch by leadoff | with 2 outs | fly | gnd | fly/ | |||||||||||||
| Player | h | ab | avg | h | ab | avg | h | ab | avg | h | ab | avg | rch | ops | pct | h | ab | avg | out | out | gnd |
| BAYLISS D | 5 | 5 | 1.000 | 41 | 138 | .297 | 25 | 86 | .291 | 21 | 57 | .368 | 18 | 31 | .581 | 17 | 50 | .340 | 34 | 35 | 1.0 |
| PERKINS D | 1 | 5 | .200 | 15 | 61 | .246 | 12 | 40 | .300 | 4 | 26 | .154 | 7 | 15 | .467 | 2 | 22 | .091 | 16 | 11 | 1.5 |
| JOHNSON J | 0 | 1 | .000 | 12 | 59 | .203 | 10 | 36 | .278 | 2 | 24 | .083 | 7 | 17 | .412 | 2 | 18 | .111 | 5 | 19 | 0.3 |
| THORNE J | 0 | 0 | — | 4 | 14 | .286 | 2 | 10 | .200 | 2 | 4 | .500 | 3 | 4 | .750 | 1 | 4 | .250 | 1 | 2 | 0.5 |
| SCRITTEN M | 0 | 9 | .000 | 8 | 37 | .216 | 4 | 29 | .138 | 4 | 17 | .235 | 7 | 13 | .538 | 2 | 14 | .143 | 13 | 12 | 1.1 |
| LARNEY Z | 0 | 0 | — | 2 | 5 | .400 | 2 | 5 | .400 | 0 | 0 | — | 0 | 0 | — | 2 | 4 | .500 | 1 | 0 | 99.9 |
| Totals | 6 | 20 | .300 | 82 | 314 | .261 | 55 | 206 | .267 | 33 | 128 | .258 | 42 | 80 | .525 | 26 | 112 | .232 | 70 | 79 | 0.9 |
| Opponents | 0 | 0 | — | 102 | 334 | .305 | 66 | 186 | .355 | 36 | 148 | .243 | 32 | 80 | .400 | 37 | 112 | .330 | 95 | 46 | 2.1 |
| Player | app-gs | ip/ app | h/g | r/g | er/g | bb/g | so/g | k/bb ratio | 2b/g | 3b/g | hr/g | fo/g | go/g | bf/g | sba-att | sba pct |
| BAYLISS D | 7-4 | 4.52 | 13.07 | 9.95 | 5.97 | 3.13 | 5.40 | 1.7 | 1.99 | 0.57 | 0.28 | 9.66 | 9.95 | 46.04 | 10-15 | .667 |
| PERKINS D | 6-2 | 2.83 | 8.47 | 11.12 | 9.00 | 10.59 | 11.65 | 1.1 | 2.12 | 0.00 | 0.00 | 8.47 | 5.82 | 47.12 | 6-7 | .857 |
| JOHNSON J | 6-3 | 2.44 | 7.36 | 11.05 | 5.52 | 11.66 | 11.05 | 0.9 | 1.23 | 0.00 | 0.00 | 3.07 | 11.66 | 50.93 | 10-11 | .909 |
| THORNE J | 1-0 | 3.33 | 10.80 | 13.50 | 13.50 | 8.10 | 18.90 | 2.3 | 2.70 | 0.00 | 0.00 | 2.70 | 5.40 | 56.70 | 1-1 | 1.000 |
| SCRITTEN M | 3-1 | 4.11 | 5.84 | 7.30 | 4.38 | 6.57 | 6.57 | 1.0 | 0.00 | 0.00 | 0.73 | 9.49 | 8.76 | 45.97 | 1-2 | .500 |
| LARNEY Z | 2-0 | 0.50 | 18.00 | 9.00 | 9.00 | 9.00 | 18.00 | 2.0 | 0.00 | 0.00 | 0.00 | 9.00 | 0.00 | 54.00 | 0-0 | — |
| Totals | 10-10 | 8.00 | 9.90 | 10.12 | 6.64 | 7.09 | 8.66 | 1.2 | 1.58 | 0.22 | 0.22 | 7.88 | 8.89 | 47.70 | 28-36 | .795 |
| Opponents | 10-10 | 7.87 | 11.67 | 12.70 | 8.58 | 7.67 | 8.92 | 1.2 | 1.94 | 0.00 | 1.03 | 10.87 | 5.26 | 49.77 | 31-39 | .778 |
- = average based on 9-inning game
| Per-Game Statistics |
CTBF ML 2018/2019 SEASON
Per-Game Statistics for VOB (as of Dec 19, 2018)
(All games Sorted by Batting avg)
• Record: 7-3 • Home: 4-1 • Away: 3-2 • Conference: 7-3 •
| Player | g | ab | h/g | 2b/g | 3b/g | hr/g | bb/g | so/g | rbi/g | sb/g | r/g | *ab | *r | *h | *rbi | *bb | *k | *tb | *fly | *gnd |
| MULLINS K | 1 | 1 | 1.00 | .00 | .00 | .00 | .00 | .00 | .00 | .00 | .00 | 100 | 0 | 100 | 0 | 0 | 0 | 100 | 0 | 0 |
| PRETORIUS Y | 2 | 1 | .50 | .00 | .00 | .00 | .00 | .00 | .50 | .00 | 1.00 | 100 | 200 | 100 | 100 | 0 | 0 | 100 | 0 | 0 |
| THORNE J | 1 | 3 | 2.00 | .00 | .00 | .00 | .00 | .00 | 2.00 | 1.00 | 2.00 | 60 | 40 | 40 | 40 | 0 | 0 | 40 | 0 | 0 |
| MAHONEY MARV | 5 | 12 | 1.00 | .40 | .00 | .00 | .20 | .00 | 1.20 | .00 | .60 | 92 | 23 | 38 | 46 | 7 | 0 | 53 | 53 | 7 |
| BAYLISS D | 10 | 33 | 1.30 | .10 | .00 | .20 | .70 | .70 | 1.10 | .20 | 1.10 | 71 | 23 | 28 | 23 | 15 | 15 | 43 | 21 | 8 |
| GORDON L | 10 | 38 | 1.30 | .30 | .00 | .30 | .60 | .70 | 1.90 | .30 | 1.40 | 80 | 29 | 27 | 40 | 12 | 14 | 53 | 27 | 6 |
| HAYNES J | 7 | 24 | 1.14 | .43 | .00 | .00 | 1.14 | 1.29 | .14 | .86 | 1.71 | 68 | 34 | 22 | 2 | 22 | 25 | 31 | 8 | 8 |
| SCRITTEN M | 10 | 34 | 1.10 | .10 | .00 | .00 | .60 | .40 | .60 | .20 | .80 | 82 | 19 | 26 | 14 | 14 | 9 | 29 | 34 | 12 |
| PERKINS D | 7 | 16 | .71 | .14 | .00 | .00 | .14 | 1.00 | .29 | .14 | .57 | 94 | 23 | 29 | 11 | 5 | 41 | 35 | 17 | 5 |
| JOHNSON J | 10 | 28 | .80 | .10 | .00 | .30 | .80 | .60 | .90 | .10 | 1.20 | 73 | 31 | 21 | 23 | 21 | 15 | 47 | 21 | 13 |
| NOVEMBER L | 10 | 32 | .90 | .30 | .00 | .00 | 1.20 | .40 | .60 | .50 | 1.50 | 64 | 30 | 18 | 12 | 24 | 8 | 24 | 24 | 10 |
| LARNEY Z | 10 | 36 | .90 | .00 | .00 | .00 | 1.10 | 1.00 | 1.10 | .60 | 1.10 | 73 | 22 | 18 | 22 | 22 | 20 | 18 | 18 | 10 |
| WILLEMBERG L | 9 | 29 | .78 | .00 | .00 | .00 | .11 | .67 | .56 | .11 | .67 | 90 | 18 | 21 | 15 | 3 | 18 | 21 | 15 | 25 |
| BURCH J | 10 | 38 | .90 | .20 | .00 | .10 | .50 | 1.60 | 1.00 | .30 | .90 | 77 | 18 | 18 | 20 | 10 | 32 | 28 | 16 | 6 |
| BUDLER L | 3 | 6 | .33 | .00 | .00 | .00 | .00 | .33 | .00 | .00 | .33 | 100 | 16 | 16 | 0 | 0 | 16 | 16 | 16 | 50 |
| DARIUS M | 2 | 1 | .00 | .00 | .00 | .00 | .50 | .00 | .00 | .00 | .50 | 50 | 50 | 0 | 0 | 50 | 0 | 0 | 50 | 0 |
| JONES R | 2 | 1 | .00 | .00 | .00 | .00 | .00 | .00 | .00 | .00 | .00 | 50 | 0 | 0 | 0 | 0 | 0 | 0 | 50 | 0 |
| RANCK J | 1 | 1 | .00 | .00 | .00 | .00 | .00 | 1.00 | .00 | .00 | .00 | 100 | 0 | 0 | 0 | 0 | 100 | 0 | 0 | 0 |
| Totals | 10 | 334 | 10.20 | 1.70 | .00 | .90 | 6.70 | 7.80 | 8.90 | 3.10 | 11.10 | 76 | 25 | 23 | 20 | 15 | 17 | 33 | 21 | 10 |
| Opponents | 10 | 334 | 8.80 | 1.40 | .20 | .20 | 6.30 | 7.70 | 6.30 | 2.80 | 9.00 | 78 | 21 | 20 | 14 | 14 | 18 | 26 | 16 | 18 |
- = average based on 100 plate appearances
(All games Sorted by Earned run avg)
| Player | app | ip | ip/app | w | l | +ip | +h | +r | +er | +bb | +so | +2b | +3b | +hr | +bf | +era | +fly | +gnd |
| SCRITTEN M | 3 | 12.1 | 4.0 | 2 | 0 | 9.0 | 5.8 | 7.3 | 4.4 | 6.6 | 6.6 | — | — | 0.7 | 46.0 | 4.38 | 9.5 | 8.8 |
| JOHNSON J | 6 | 14.2 | 2.1 | 1 | 0 | 9.0 | 7.4 | 11.0 | 5.5 | 11.7 | 11.0 | 1.2 | — | — | 50.9 | 5.52 | 3.1 | 11.7 |
| BAYLISS D | 7 | 31.2 | 4.1 | 2 | 1 | 9.0 | 13.1 | 9.9 | 6.0 | 3.1 | 5.4 | 2.0 | 0.6 | 0.3 | 46.0 | 5.97 | 9.7 | 9.9 |
| PERKINS D | 6 | 17.0 | 2.2 | 2 | 1 | 9.0 | 8.5 | 11.1 | 9.0 | 10.6 | 11.6 | 2.1 | — | — | 47.1 | 9.00 | 8.5 | 5.8 |
| LARNEY Z | 2 | 1.0 | 0.1 | 0 | 1 | 9.0 | 18.0 | 9.0 | 9.0 | 9.0 | 18.0 | — | — | — | 54.0 | 9.00 | 9.0 | 0.0 |
| THORNE J | 1 | 3.1 | 3.1 | 0 | 0 | 9.0 | 10.8 | 13.5 | 13.5 | 8.1 | 18.9 | 2.7 | — | — | 56.7 | 13.50 | 2.7 | 5.4 |
| Totals | 10 | 80.0 | 8.0 | 7 | 3 | 9.0 | 9.9 | 10.1 | 6.6 | 7.1 | 8.7 | 1.6 | 0.2 | 0.2 | 47.7 | 6.64 | 7.9 | 8.9 |
| Opponents | 10 | 78.2 | 7.2 | 3 | 7 | 9.0 | 11.7 | 12.7 | 8.6 | 7.7 | 8.9 | 1.9 | — | 1.0 | 49.8 | 8.58 | 10.9 | 5.3 |
- = average based on 9-inning game
| Season Game Highs |
CTBF ML 2018/2019 SEASON
Season Game Highs for VOB (as of Dec 19, 2018)
(All games)
TEAM GAME HIGHS
Batting
| At bats: | 41 | – | vs BELLVILLE TYGERS (Oct 20, 2018) |
| Runs scored: | 21 | – | vs MAVERICKS (Dec 01, 2018) |
| Hits: | 16 | – | vs CRUSADERS (Nov 17, 2018) |
| RBIs: | 18 | – | vs MAVERICKS (Dec 01, 2018) |
| Doubles: | 4 | – | vs HELDERBERG PIRATES (Nov 18, 2018) |
| Home runs: | 6 | – | vs MAVERICKS (Dec 01, 2018) |
| Total bases: | 34 | – | vs MAVERICKS (Dec 01, 2018) |
| Walks: | 12 | – | vs MAITLAND GIANTS (Nov 24, 2018) |
| Strikeouts: | 17 | – | vs BOTHASIG (Oct 27, 2018) |
| Sac hits: | 2 | – | vs BELLVILLE TYGERS (Oct 20, 2018) |
| Sac flies: | 3 | – | vs CRUSADERS (Nov 17, 2018) |
| Stolen bases: | 6 | – | vs MAVERICKS (Dec 01, 2018) |
| Hit by pitch: | 6 | – | vs MAITLAND GIANTS (Nov 24, 2018) |
| Caught stealing: | 3 | – | vs WESTRIDGE YANKEES (Dec 16, 2018) |
| Runners LOB: | 13 | – | vs BELLVILLE TYGERS (Oct 20, 2018) |
| Hit into DP: | 2 | – | vs HELDERBERG PIRATES (Nov 18, 2018) |
Fielding
| Putouts: | 30 | – | vs CRUSADERS (Nov 17, 2018) |
| Assists: | 14 | – | vs CRUSADERS (Nov 17, 2018) |
| Errors: | 8 | – | vs CRUSADERS (Nov 17, 2018) |
| Passed balls: | 3 | – | vs HELDERBERG PIRATES (Nov 18, 2018) |
| DPs turned: | 1 | – | vs BELLVILLE TYGERS (Oct 20, 2018) |
| 1 | – | vs BOTHASIG (Oct 27, 2018) | |
| 1 | – | vs VD STEL (Nov 03, 2018) |
Pitching
| Innings pitched: | 10.0 | – | vs CRUSADERS (Nov 17, 2018) |
| Runs allowed: | 17 | – | vs BOTHASIG (Oct 27, 2018) |
| 17 | – | vs CRUSADERS (Nov 17, 2018) | |
| Earned runs: | 11 | – | vs HELDERBERG PIRATES (Nov 18, 2018) |
| Walks allowed: | 9 | – | vs CRUSADERS (Nov 17, 2018) |
| Strikeouts: | 11 | – | vs HELDERBERG PIRATES (Nov 18, 2018) |
| 11 | – | vs MAVERICKS (Dec 01, 2018) | |
| Hits allowed: | 13 | – | vs HELDERBERG PIRATES (Nov 18, 2018) |
| 13 | – | vs DURBANVILLE (Dec 08, 2018) | |
| Doubles allowed: | 4 | – | vs BOTHASIG (Oct 27, 2018) |
| Triples allowed: | 1 | – | vs BELLVILLE TYGERS (Oct 20, 2018) |
| 1 | – | vs DURBANVILLE (Dec 08, 2018) | |
| Homers allowed: | 1 | – | vs DURBANVILLE (Dec 08, 2018) |
| 1 | – | vs WESTRIDGE YANKEES (Dec 16, 2018) | |
| Wild pitches: | 4 | – | vs BOTHASIG (Oct 27, 2018) |
| Hit batters: | 6 | – | vs CRUSADERS (Nov 17, 2018) |
INDIVIDUAL GAME HIGHS
Batting
| At bats: | 6 | – | LARNEY Z vs BELLVILLE TYGERS (Oct 20, 2018) |
| 6 | – | MAHONEY MARV vs CRUSADERS (Nov 17, 2018) | |
| Runs scored: | 4 | – | HAYNES J vs BELLVILLE TYGERS (Oct 20, 2018) |
| 4 | – | HAYNES J vs HELDERBERG PIRATES (Nov 18, 2018) | |
| Hits: | 4 | – | BURCH J vs MAVERICKS (Dec 01, 2018) |
| RBIs: | 5 | – | BURCH J vs MAVERICKS (Dec 01, 2018) |
| Doubles: | 2 | – | HAYNES J vs HELDERBERG PIRATES (Nov 18, 2018) |
| Home runs: | 2 | – | JOHNSON J vs MAVERICKS (Dec 01, 2018) |
| 2 | – | GORDON L vs MAVERICKS (Dec 01, 2018) | |
| Total bases: | 8 | – | GORDON L vs MAVERICKS (Dec 01, 2018) |
| 8 | – | JOHNSON J vs MAVERICKS (Dec 01, 2018) | |
| 8 | – | BURCH J vs MAVERICKS (Dec 01, 2018) | |
| Walks: | 3 | – | (4 times ) |
| Strikeouts: | 3 | – | HAYNES J vs BOTHASIG (Oct 27, 2018) |
| 3 | – | BURCH J vs THISTLES (Dec 02, 2018) | |
| 3 | – | BURCH J vs WESTRIDGE YANKEES (Dec 16, 2018) | |
| Sac hits: | 1 | – | WILLEMBERG L vs BELLVILLE TYGERS (Oct 20, 2018) |
| 1 | – | BAYLISS D vs BELLVILLE TYGERS (Oct 20, 2018) | |
| 1 | – | JOHNSON J vs WESTRIDGE YANKEES (Dec 16, 2018) | |
| Sac flies: | 1 | – | (10 times ) |
| Stolen bases: | 3 | – | LARNEY Z vs MAVERICKS (Dec 01, 2018) |
| Hit by pitch: | 2 | – | BURCH J vs CRUSADERS (Nov 17, 2018) |
| 2 | – | THORNE J vs HELDERBERG PIRATES (Nov 18, 2018) | |
| Caught stealing: | 1 | – | (8 times ) |
| Runners LOB: | 5 | – | GORDON L vs BELLVILLE TYGERS (Oct 20, 2018) |
| 5 | – | WILLEMBERG L vs BELLVILLE TYGERS (Oct 20, 2018) | |
| 5 | – | BURCH J vs THISTLES (Dec 02, 2018) |
Fielding
| Putouts: | 11 | – | BURCH J vs BELLVILLE TYGERS (Oct 20, 2018) |
| 11 | – | BURCH J vs CRUSADERS (Nov 17, 2018) | |
| Assists: | 6 | – | WILLEMBERG L vs BELLVILLE TYGERS (Oct 20, 2018) |
| Errors: | 3 | – | MAHONEY MARV vs CRUSADERS (Nov 17, 2018) |
| Passed balls: | 2 | – | GORDON L vs HELDERBERG PIRATES (Nov 18, 2018) |
Pitching
| Innings pitched: | 7.0 | – | BAYLISS D vs THISTLES (Dec 02, 2018) |
| Runs allowed: | 10 | – | JOHNSON J vs CRUSADERS (Nov 17, 2018) |
| 10 | – | BAYLISS D vs DURBANVILLE (Dec 08, 2018) | |
| Earned runs: | 6 | – | PERKINS D vs BOTHASIG (Oct 27, 2018) |
| Walks allowed: | 6 | – | PERKINS D vs BOTHASIG (Oct 27, 2018) |
| 6 | – | JOHNSON J vs VD STEL (Nov 03, 2018) | |
| 6 | – | SCRITTEN M vs WESTRIDGE YANKEES (Dec 16, 2018) | |
| Strikeouts: | 7 | – | THORNE J vs HELDERBERG PIRATES (Nov 18, 2018) |
| 7 | – | BAYLISS D vs THISTLES (Dec 02, 2018) | |
| 7 | – | PERKINS D vs MAVERICKS (Dec 01, 2018) | |
| Hits allowed: | 9 | – | BAYLISS D vs DURBANVILLE (Dec 08, 2018) |
| Doubles allowed: | 2 | – | BAYLISS D vs BELLVILLE TYGERS (Oct 20, 2018) |
| 2 | – | PERKINS D vs BOTHASIG (Oct 27, 2018) | |
| 2 | – | BAYLISS D vs BOTHASIG (Oct 27, 2018) | |
| Triples allowed: | 1 | – | BAYLISS D vs BELLVILLE TYGERS (Oct 20, 2018) |
| 1 | – | BAYLISS D vs DURBANVILLE (Dec 08, 2018) | |
| Homers allowed: | 1 | – | BAYLISS D vs DURBANVILLE (Dec 08, 2018) |
| 1 | – | SCRITTEN M vs WESTRIDGE YANKEES (Dec 16, 2018) | |
| Wild pitches: | 4 | – | PERKINS D vs BOTHASIG (Oct 27, 2018) |
| Hit batters: | 4 | – | THORNE J vs HELDERBERG PIRATES (Nov 18, 2018) |
| Team Game-by-Game |
CTBF ML 2018/2019 SEASON
Team Game-by-Game for VOB (as of Dec 19, 2018)
Batting (All games)
| Date | Opponent | ab | r | h | rbi | 2b | 3b | hr | bb | ibb | sb | cs | hbp | sh | sf | gdp | k | po | a | e | avg | ||
| * | Oct 20, 2018 | at | BELLVILLE TYGERS | 41 | 10 | 12 | 5 | 1 | 0 | 0 | 6 | 0 | 2 | 1 | 0 | 2 | 1 | 0 | 7 | 27 | 13 | 2 | .293 |
| * | Oct 27, 2018 | BOTHASIG | 22 | 0 | 1 | 0 | 0 | 0 | 0 | 4 | 0 | 1 | 0 | 0 | 0 | 0 | 1 | 17 | 21 | 9 | 7 | .206 | |
| * | Nov 03, 2018 | at | VD STEL | 37 | 10 | 11 | 9 | 1 | 0 | 3 | 5 | 0 | 2 | 1 | 1 | 0 | 0 | 1 | 9 | 27 | 10 | 1 | .240 |
| * | Nov 17, 2018 | CRUSADERS | 40 | 18 | 16 | 15 | 2 | 0 | 0 | 9 | 0 | 3 | 1 | 3 | 0 | 3 | 1 | 7 | 30 | 14 | 8 | .286 | |
| * | Nov 18, 2018 | at | HELDERBERG PIRATES | 38 | 11 | 12 | 7 | 4 | 0 | 0 | 6 | 0 | 5 | 0 | 4 | 0 | 1 | 0 | 3 | 24 | 7 | 2 | .292 |
| * | Nov 24, 2018 | MAITLAND GIANTS | 24 | 19 | 10 | 16 | 3 | 0 | 0 | 12 | 0 | 2 | 0 | 6 | 0 | 1 | 0 | 9 | 15 | 5 | 2 | .307 | |
| * | Dec 02, 2018 | THISTLES | 34 | 6 | 9 | 6 | 1 | 0 | 0 | 5 | 0 | 4 | 0 | 1 | 0 | 2 | 0 | 7 | 27 | 13 | 3 | .301 | |
| * | Dec 01, 2018 | at | MAVERICKS | 33 | 21 | 15 | 18 | 1 | 0 | 6 | 7 | 0 | 6 | 1 | 1 | 0 | 1 | 0 | 3 | 18 | 6 | 4 | .320 |
| * | Dec 08, 2018 | at | DURBANVILLE | 33 | 6 | 8 | 5 | 2 | 0 | 0 | 4 | 0 | 3 | 1 | 2 | 0 | 0 | 0 | 8 | 24 | 8 | 4 | .311 |
| * | Dec 16, 2018 | WESTRIDGE YANKEES | 32 | 10 | 8 | 8 | 2 | 0 | 0 | 9 | 0 | 3 | 3 | 2 | 1 | 1 | 0 | 8 | 27 | 7 | 4 | .305 | |
| Totals | 334 | 111 | 102 | 89 | 17 | 0 | 9 | 67 | 0 | 31 | 8 | 20 | 3 | 10 | 3 | 78 | 240 | 92 | 37 | .305 |
CTBF ML 2018/2019 SEASON
Team Game-by-Game for VOB (as of Dec 19, 2018)
Pitching (All games)
| Date | Opponent | ip | h | r | er | bb | so | 2b | 3b | hr | wp | bk | hbp | dp | ibb | score | w | l | sv | era | ||
| * | Oct 20, 2018 | BELLVILLE TYGERS | 9.0 | 8 | 5 | 5 | 6 | 6 | 3 | 1 | 0 | 1 | 1 | 2 | 1 | 0 | 10-5 | 1 | 0 | 1 | 5.00 | |
| * | Oct 27, 2018 | BOTHASIG | 7.0 | 12 | 17 | 10 | 6 | 3 | 4 | 0 | 0 | 4 | 0 | 1 | 1 | 0 | 0-17 | 1 | 1 | 1 | 8.44 | |
| * | Nov 03, 2018 | VD STEL | 9.0 | 9 | 6 | 6 | 6 | 10 | 2 | 0 | 0 | 0 | 0 | 1 | 1 | 0 | 10-6 | 2 | 1 | 1 | 7.56 | |
| * | Nov 17, 2018 | CRUSADERS | 10.0 | 12 | 17 | 5 | 9 | 9 | 0 | 0 | 0 | 1 | 0 | 6 | 0 | 0 | 18-17 | 3 | 1 | 1 | 6.69 | |
| * | Nov 18, 2018 | HELDERBERG PIRATES | 8.0 | 13 | 12 | 11 | 6 | 11 | 2 | 0 | 0 | 2 | 0 | 4 | 0 | 0 | 11-12 | 3 | 2 | 1 | 7.74 | |
| * | Nov 24, 2018 | MAITLAND GIANTS | 5.0 | 6 | 4 | 2 | 6 | 3 | 0 | 0 | 0 | 2 | 0 | 1 | 0 | 0 | 19-4 | 4 | 2 | 1 | 7.31 | |
| * | Dec 02, 2018 | THISTLES | 9.0 | 9 | 5 | 5 | 3 | 8 | 1 | 0 | 0 | 0 | 0 | 2 | 0 | 0 | 6-5 | 5 | 2 | 2 | 6.95 | |
| * | Dec 01, 2018 | MAVERICKS | 6.0 | 1 | 4 | 2 | 7 | 11 | 0 | 0 | 0 | 0 | 0 | 0 | 0 | 0 | 21-4 | 6 | 2 | 2 | 6.57 | |
| * | Dec 08, 2018 | DURBANVILLE | 8.0 | 13 | 14 | 9 | 7 | 7 | 2 | 1 | 1 | 0 | 0 | 0 | 0 | 1 | 6-14 | 6 | 3 | 2 | 6.97 | |
| * | Dec 16, 2018 | WESTRIDGE YANKEES | 9.0 | 5 | 6 | 4 | 7 | 9 | 0 | 0 | 1 | 0 | 0 | 1 | 0 | 0 | 10-6 | 7 | 3 | 3 | 6.64 | |
| Totals | 80.0 | 88 | 90 | 59 | 63 | 77 | 14 | 2 | 2 | 10 | 1 | 18 | 3 | 1 | 111-90 | 7 | 3 | 3 | 6.64 |
- = Conference game

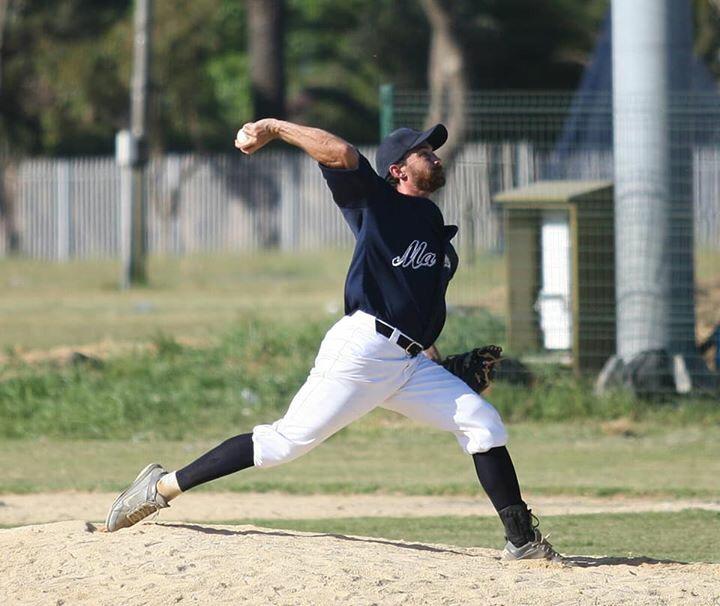


 We played at our home ground for the first time since the season started. God is great. Glen Joseph got the nod as our pitcher on the day and did a sterling job throwing a shutout. . Apparently not according to self appointed pitching coach Shaun Elliot who wanted to jerk him in the first inning after striking out the first two hitters then throwing two balls. Yep, it’s tough being in the Masters pitching rotation.
 Thistle came out firing, scoring 2 unanswered runs in the first inning against a Macaw side who probably took this win for granted. VOB only got their first hit in the third inning and were being frustrated by Keegan “Gazza” Watson, the thistle starter.